48–72 Hour Signals: Influencer Campaign Metrics for Brand Managers
15 min read

Pick one primary KPI tied to your campaign objective, then track one or two diagnostic metrics that explain why the number moved. Awareness campaigns run on reach, impressions, or CPM. Consideration campaigns live or die on engagement rate and CTR. Conversion campaigns answer to conversions, CPA, and ROAS. Everything else in this guide exists to help you set those numbers correctly, track them without gaps, and report them in a way that survives a budget meeting.
TL;DR:
- Reach and CPM are the primary KPIs for awareness campaigns, while engagement rate and CTR are key for consideration, and conversions or ROAS for sales-focused efforts.
- Use one primary KPI aligned with the campaign goal and support it with one or two diagnostic metrics, avoiding blended reporting across multiple objectives.
- Track conversions with redundant methods like UTMs, promo codes, affiliate links, and post-purchase surveys to accurately attribute sales across devices and platforms.
- Segment metrics by platform, creator tier, and audience demographics to identify where the actual conversion potential lies within a campaign.
- Incorporate sentiment analysis and content quality signals such as comments, shares, and saves to ensure quantitative success aligns with brand trust and long-term value.
Table of Contents
- Which Influencer Campaign Metrics Matter by Objective?
- Core Influencer Metrics: Formulas and What They Actually Tell You
- How to Set Up Tracking and Attribution for Influencer Campaigns
- Benchmarks: Setting Realistic Targets by Platform and Creator Tier
- How to Structure Influencer Campaign Reporting
- What Measurement Mistakes Hurt Influencer Campaign ROI?
- Practical Checklist for Measuring an Influencer Campaign
- Reading Influencer Metrics Against Brand Goals and the Wider Marketing Mix
- Segmenting Influencer Metrics by Audience and Platform
- Using Analytics Tools and Dashboards for Deeper Influencer Insights
- Should You Track Sentiment and Content Quality, Not Just Volume?
- Author Perspective: What Actually Slows Measurement Down
- Sources
- FAQ
Which Influencer Campaign Metrics Matter by Objective?
Most measurement failures start before the campaign launches. Somebody picks five KPIs because they all sound good, then spends the recap meeting explaining why engagement rate looks great while sales look flat. The fix is blunt: match one primary KPI to the objective, and let one or two diagnostic metrics do the explaining.
Later's guidance on influencer measurement recommends exactly this structure: a single primary KPI tied to the campaign goal, backed by supporting metrics that add context without diluting the verdict. Here's how that breaks down in practice:
- Awareness: Primary KPI is reach or CPM. Diagnostics include impressions-to-reach ratio (frequency) and share of voice.
- Consideration: Primary KPI is engagement rate or CTR. Diagnostics include saves, shares, and comment sentiment.
- Conversion: Primary KPI is conversions, CPA, or ROAS. Diagnostics include add-to-cart rate and promo-code redemption.
Blended goals are common, especially on longer retainer deals, but resist the urge to average everything together. If a campaign has both an awareness phase and a conversion push, split reporting by phase instead of reporting one blended scorecard. A launch-week awareness push measured against CPA will always look like a failure, because that was never its job.
Core Influencer Metrics: Formulas and What They Actually Tell You
Formulas matter less than knowing which one lies to you. Here's the working list marketers need, with the interpretation attached:
- Reach: Unique accounts that saw the content. Tells you audience size, not attention.
- Impressions: Total views, including repeats. Impressions ÷ reach = frequency, a sneaky-useful number for spotting algorithm boosts.
- Engagement rate (reach based): Engagements ÷ reach × 100. This is the version to trust.
- Engagement rate (follower based): Engagements ÷ followers × 100. Common, but easy to inflate with a purchased or dormant audience.
- CTR: Link clicks ÷ impressions × 100. Tells you if the content actually made people act.
- Conversion rate: Conversions ÷ clicks × 100. The bridge between traffic and revenue.
- CPA: Total cost ÷ conversions. The number that determines if a creator relationship survives renewal.
- CPM: Cost ÷ (impressions ÷ 1,000). Useful for comparing awareness deals across creators of different sizes.
- CPE: Cost ÷ total engagements. Good for evaluating consideration-stage spend.
- ROAS: Revenue ÷ ad spend. Usually paired with paid amplification, not organic posts alone.
- EMV: A modeled dollar value assigned to earned exposure. Treat it as a talking point, not a budget input.
- Promo-code redemption rate: Codes used ÷ codes distributed. One of the cleanest conversion signals available.
- View-through/completion rate: Full-length views ÷ total views. Tells you if the creative held attention past the hook.
Pro Tip: Favor reach-based engagement rate over follower-based ER whenever the platform gives you reach data. Follower-based ER can look strong on an account padded with inactive followers, while the reach-based version exposes what the content actually earned. This lines up with how analysts increasingly frame ER: as a trust signal, not just a vanity stat.
Platform math complicates things further. Instagram Reels, TikTok's For You feed, and YouTube Shorts each weight completion and rewatch differently in their own analytics, so a "high engagement" video on TikTok isn't directly comparable to one on Instagram. Use the engagement rate formulas here as a baseline, then normalize by platform rather than pooling numbers into one blended average.
How to Set Up Tracking and Attribution for Influencer Campaigns
No single tracking method survives contact with real influencer campaigns. Links get screenshotted, codes get shared outside the campaign, and half your audience clicks from a phone but buys on a desktop later that night. The fix is redundancy, not a better single tool.
- Assign unique promo codes per creator. Codes solve the cross-device problem UTMs can't: someone clicks on mobile, buys on laptop, but the code still ties the sale back to the right creator.
- Add affiliate links where the platform supports them, particularly on YouTube and TikTok Shop, where native purchase flows often bypass your site's UTM tracking entirely.
- Run post-purchase surveys ("How did you hear about us?") to catch the influenced-but-unclicked buyer.
- Measure branded search lift over two to four weeks for platforms like TikTok, where links inside native content are limited or unavailable. Combining at least two fallback methods is standard advice for triangulating impact when direct links aren't an option.
Pro Tip: Treat promo codes and UTMs as a pair, not an either/or. A code catches the buyer who forgot to click; a UTM catches the click that never converts to a code redemption.
Benchmarks: Setting Realistic Targets by Platform and Creator Tier
Benchmarks vary enough by creator tier that a single "good engagement rate" number is close to meaningless. Micro-influencers, generally under 100,000 followers, tend to post reach-based engagement rates in the 3 to 6 percent range, while macro and celebrity-tier creators often land lower on engagement but deliver far broader reach in a single post, according to industry benchmark data. CPM and CTR follow similar tiering, with mid-tier creators often striking the best balance between cost efficiency and audience trust.
Rather than importing a benchmark from a blog post, reverse-engineer your own target from the business goal. Start with the revenue target and average order value to calculate the conversions you need. Apply an expected conversion rate to back into required clicks, then use expected CTR and CPM to calculate the impressions and budget required to get there.
- Pull the last six months of your own campaign data as a baseline before setting new targets.
- Segment benchmarks by creator tier, not just platform. A micro versus macro comparison will change your CPA math more than a platform switch will.
- Rebuild your budget model with full-cost inputs, not just creator fees, or your CPA will look better than it actually is.
How to Structure Influencer Campaign Reporting
Split reporting into two layers with guidance from the Marketing Insights & Blog | TBE Agency. Campaign-level (macro) reporting rolls up total reach, blended engagement rate, aggregate spend, and overall ROAS. Creator or post-level (micro) reporting breaks the same numbers down per creator, so you can spot which one is actually driving the result.
A useful dashboard includes both, plus the assumptions behind them:
- Primary KPI and its trend against the campaign target
- Diagnostic metrics for context (frequency, saves, CTR by creator)
- Full cost basis, including fees, production, and paid amplification
- Attribution method used per conversion (UTM, code, survey)
Recommended cadence: check early signals at 48 to 72 hours, run a weekly campaign check during the live window, do a full post-campaign deep dive, and roll results into a quarterly program review. A unified macro-and-micro approach makes it far easier to defend results when a stakeholder asks "why did this creator underperform" mid-campaign.
What Measurement Mistakes Hurt Influencer Campaign ROI?
Vanity metrics are the most common trap: follower counts and raw likes rarely predict revenue. Incomplete cost accounting is the second, quieter problem. Counting only the flat creator fee and ignoring production, seeding, and paid boost spend inflates your ROAS and sets a false benchmark for next quarter, a mistake that full-cost ROI models are built to prevent.
- Watch for sudden engagement spikes with no comment quality to match. It often signals bot activity, not resonance.
- Check audience overlap across creators before assuming reach is additive.
- Confirm disclosure compliance. Undisclosed sponsorships create legal risk and skew trust signals.
Pro Tip: Treat EMV and any model-driven "equivalent value" metric as a talking point for leadership decks, never as an input to your actual ROI calculation.
Practical Checklist for Measuring an Influencer Campaign
- Pre-launch: Lock the primary KPI, build UTMs, assign promo codes, confirm analytics access, and settle content usage rights.
- During the campaign: Watch 48 to 72 hour signals and reallocate budget toward creators outperforming target CPA or engagement.
- Post-campaign: Calculate full-cost ROI, cross-check attribution sources, and log what worked into a reusable reporting template.
Reading Influencer Metrics Against Brand Goals and the Wider Marketing Mix
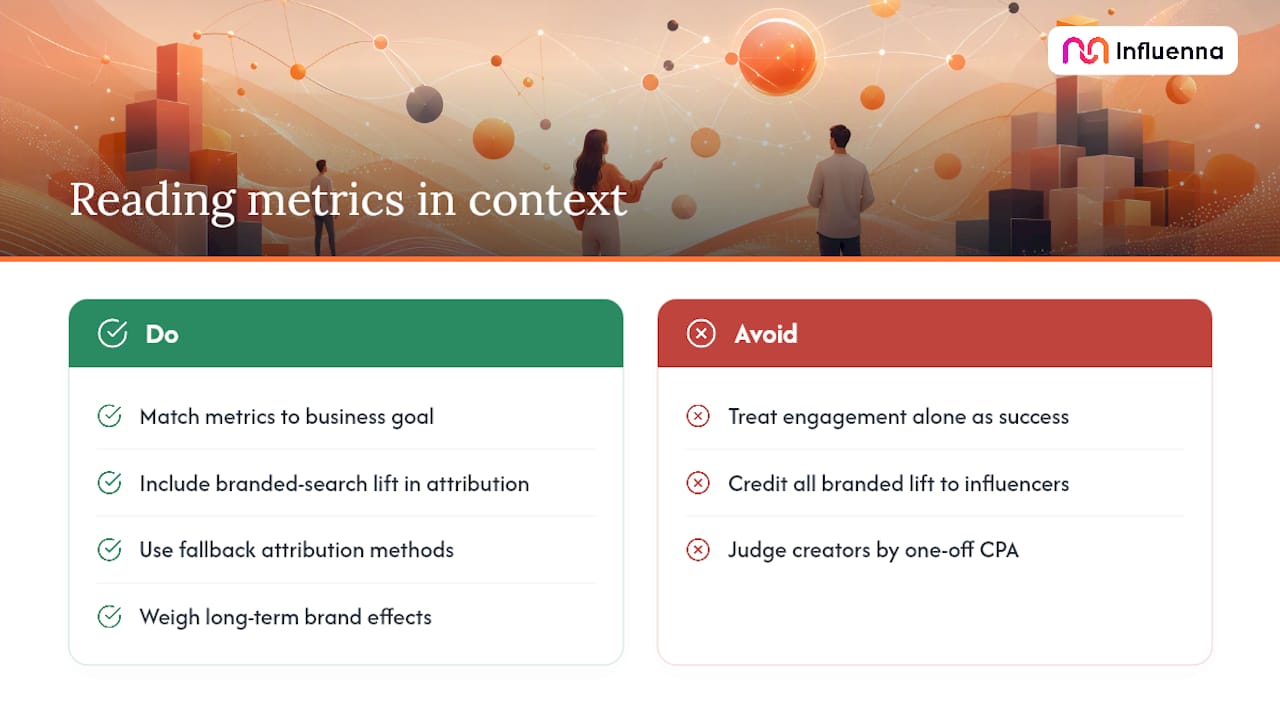
An influencer campaign metric only means something next to a business goal. A 4 percent engagement rate is a strong number for a consideration campaign and an almost irrelevant one for a campaign meant to drive holiday sales. Before reporting a result as a win or a loss, ask what it was actually supposed to move.
Context also comes from the rest of the marketing mix. If paid search saw a lift in branded queries during an influencer push, some of that "organic" search traffic was influencer-driven, even without a click. Ignoring that connection undercounts influencer impact; crediting all of it to influencers overstates it. The honest answer usually sits in between, which is exactly why branded search lift belongs in your fallback attribution methods rather than being treated as a nice-to-have.
Longer-running programs deserve a different lens than one-off campaigns. A single post's CPA might look worse than a paid ad's, but if that creator relationship builds trust over six months and lowers CPA on every campaign after the first, the one-off number was never the right way to judge it. Weigh short-term performance metrics against the brand equity and repeat-purchase behavior an influencer relationship builds over time, not just the launch-week numbers.
Segmenting Influencer Metrics by Audience and Platform
Aggregate numbers hide the audience that actually converted. A campaign might show a moderate blended CTR while one age bracket or one region massively outperforms the rest. Breaking metrics down by audience demographics, when the platform's native analytics or your survey data allow it, often reveals that a campaign's real winner wasn't the creator with the biggest reach, but the one whose audience matched your buyer profile.
Platform nuances make blended reporting even riskier. Instagram Story link stickers, TikTok's in-app shopping links, and YouTube's description-box links each generate different click behavior, and each platform's own analytics defines "engagement" slightly differently. A comment on a YouTube video signals different intent than a TikTok share, which signals different intent than an Instagram save.
Segment your post-campaign report by:
- Platform, since CPM, CTR, and engagement definitions don't transfer cleanly between them
- Creator tier, since micro-influencer audiences often skew more niche and higher-intent
- Demographic breakdown where available, especially age and geography, to confirm the audience reached matches the audience targeted
Skipping this step is how a campaign with a strong blended average quietly underperforms with the exact buyer segment the budget was meant to reach.
Using Analytics Tools and Dashboards for Deeper Influencer Insights
Spreadsheets work for a single campaign with three creators. They fall apart once you're running concurrent campaigns across Instagram, TikTok, and YouTube with different attribution methods per platform. That's the point where a dedicated influencer analytics or social listening dashboard earns its cost, pulling native platform APIs, UTM data, and promo-code redemption into one view instead of four disconnected tabs.
The tools worth evaluating generally fall into three categories: social listening platforms for sentiment and mention tracking, influencer-specific reporting suites that pull creator-level performance automatically, and general web analytics platforms (already in most marketing stacks) configured with the UTM structure described earlier in this guide. None of these replace judgment. A dashboard will happily report a rising engagement rate driven entirely by bot comments if nobody checks the underlying data.
Whatever tool combination you land on, keep one document recording your attribution assumptions: which conversions counted as influencer-driven, which method (UTM, code, survey) got credit when two overlapped, and what counted as "engagement" for each platform. That documentation matters more the first time a finance team questions a reported ROAS number, because the dashboard alone won't answer where the number came from.
Should You Track Sentiment and Content Quality, Not Just Volume?
Yes, and skipping it is how a campaign with strong numbers still damages the brand. A creator can hit every quantitative target, high reach, solid CTR, respectable conversion rate, while the comment section fills with skepticism about the product or confusion about the offer. That's a measurement blind spot, not a win.
Sentiment analysis, even a manual read-through of top comments on the highest-performing posts, catches what click-through rate can't. Sprout Social's guidance on 2026 influencer measurement recommends pairing performance data with trust and risk signals like sentiment and disclosure compliance, treating them as core dashboard elements rather than a footnote.
Content quality matters beyond sentiment, too. A creator who nails brand fit and produces content that gets saved and shared organically, weeks after the campaign ends, is delivering compounding value a single-campaign CPA doesn't capture. Track saves and shares as content-quality signals separate from raw engagement rate, and weigh creator relationships that consistently produce high-quality, low-controversy content differently than one-off spikes in reach.
Author Perspective: What Actually Slows Measurement Down
Most measurement problems trace back to a vague brief, not a bad formula. When a brand and creator agree on the primary KPI and reporting window before content goes live, disputes over "why didn't this convert" mostly disappear. Structured requests and verified profiles, the model Influenna is built around, make that upfront agreement easier to reach than starting from a cold DM. If you're formalizing that process, Influenna's waitlist is worth joining.
— Igor
Sources
- The influencer marketing metrics to track in 2026 | Sprout Social
- Influencer Reporting: How To Measure Impact & Prove ROI
- Influencer marketing KPIs Every Brand Should Track in 2026 - partnrUP
FAQ
What Is the 5-3-2 Rule in Instagram Marketing?
The 5-3-2 rule is a content-mix guideline suggesting five shares of other people's content, three original posts, and two personal or promotional posts out of every ten, aimed at keeping an account varied rather than purely sales-focused. It's a posting-cadence framework, not a performance metric, so it sits outside standard influencer campaign KPIs.
What Are the Most Critical KPIs for Influencers?
The KPIs that matter most depend on the campaign objective, but the shortlist marketers return to most often is reach or CPM for awareness, engagement rate and CTR for consideration, and conversions, CPA, and ROAS for conversion-focused work. Pick one as primary per campaign rather than tracking all five with equal weight.
What Are the Five Key Performance Indicators in Marketing?
Marketing KPIs vary by channel and goal, but a common core set across influencer and broader digital campaigns includes reach, engagement rate, conversion rate, cost per acquisition, and return on ad spend. Each maps to a different stage of the funnel, from awareness through purchase.
How Do You Track Influencer Campaigns?
Track influencer campaigns with a redundant stack: unique UTM parameters per creator, individual promo codes, affiliate links where platforms support them, and post-purchase surveys to catch conversions that skip the click entirely. Branded search lift over two to four weeks fills the gap when native platform links aren't available, as on much of TikTok.
How Do I Calculate a Reliable Engagement Rate?
Divide total engagements (likes, comments, shares, saves) by reach, then multiply by 100, rather than dividing by follower count. Reach-based engagement rate is harder to inflate with an inactive or purchased audience than the follower-based version.