How to Calculate Engagement Rate: Formulas and Benchmarks
16 min read

Five formulas cover nearly every situation you'll face when you need to calculate engagement rate. Here's the short version:
- ER by reach (ERR): (Engagements ÷ Reach) × 100. Use this for organic Instagram posts when you want to know how well content resonated with people who actually saw it. Hootsuite calls this the most common formula for a reason.
- ER by followers: (Engagements ÷ Followers) × 100. Use this to benchmark your community over time or when reach data isn't available.
- ER by impressions: (Engagements ÷ Impressions) × 100. Use this for paid campaigns where impressions are the controlled exposure metric.
- ER by views: (Engagements ÷ Views) × 100. Use this for video content on TikTok, Instagram Reels, or YouTube Shorts.
- Cost per engagement (CPE): Total spend ÷ Total engagements. Use this when you're evaluating paid ad efficiency, not content quality.
Later sections walk through manual calculation with a worked example, how tools like Hootsuite, TheSocialCat, and HypeAuditor handle the math, and what benchmark numbers actually mean for your follower tier.
Key Takeaways
Engagement rate by reach is the most reliable formula for organic Instagram content — use it consistently, average per-post rates (not aggregate totals), and always state your denominator when sharing results with brands.
| Point | Details |
|---|---|
| Use ER by reach for organic posts | Reach excludes inactive followers and bots, giving a more accurate content-resonance signal. |
| Average per-post rates, not totals | Calculate each post's ER individually, then average those rates to avoid skewing results toward outliers. |
| A typical baseline range for engagement rates is often cited without exact fixed boundaries | Good Instagram ER varies by follower tier; micro-influencers typically see 3%–6% by reach. |
| State your methodology in every report | Include formula, denominator, time window, and sample size so brands can trust and compare your numbers. |
| Influenna connects vetted creators and brands | The curated marketplace lets creators present standardized metrics to real brand partners via structured requests. |
Table of Contents
- What engagement rate measures — and what counts as an engagement
- Core engagement-rate formulas you can copy and use right now
- How to calculate engagement rate manually, step by step
- How engagement-rate calculators work — inputs, outputs, and what to trust
- Instagram benchmarks: what a "good" engagement rate actually looks like
- How to pick the right denominator for your specific goal
- Common mistakes that make engagement rate misleading
- Copyable templates and worked examples for three common scenarios
- What to include when reporting ER to brands or negotiating rates
- The metric that matters more than the number itself
- Credible metrics are only half the equation for working with brands
- Sources
- FAQ
What engagement rate measures — and what counts as an engagement
Engagement rate measures the percentage of a given audience that interacted with a piece of content. The numerator is the sum of interactions; the denominator is whichever audience figure you choose (reach, followers, impressions, or views).
What goes in the numerator depends on the platform. Mailchimp notes that engagement definitions shift by channel: email uses opens and clicks, while social platforms use a wider mix. For Instagram, the standard set is likes, comments, shares, saves, and sometimes profile visits or link clicks. Saves carry particular weight on Instagram because they signal that someone found the content worth returning to, which the algorithm treats as a strong quality signal.
TikTok adds video completions and re-watches to the mix. LinkedIn counts reactions, comments, reposts, and clicks. The practical implication: never copy an engagement definition from one platform and apply it to another. A TikTok ER and an Instagram ER are not directly comparable, even if the numbers look similar.
Poll responses, sticker taps, DM replies triggered by a post, and link-in-bio clicks are sometimes included depending on the tool. When you're reporting to a brand, state exactly which actions you counted. Ambiguity here is one of the fastest ways to lose credibility in a pitch.
Core engagement-rate formulas you can copy and use right now
Each formula below names the denominator explicitly, because that choice changes the number more than anything else. OmniCalculator's engagement-rate tool and MeetEdgar's formula guide both document these variations, and they agree on the math even when they differ on which to recommend.
ER by reach (ERR)
ERR = (Total Engagements ÷ Reach) × 100
Denominator: unique accounts that saw the post. Best for: organic content performance, creator pitches to brands, and any situation where you want to know how content landed with actual viewers.
ER by followers
ER post = (Total Engagements ÷ Followers) × 100
Denominator: your total follower count at time of posting. Best for: tracking your own account over time or comparing accounts when reach data isn't shared.
ER by impressions
ER impressions = (Total Engagements ÷ Impressions) × 100
Denominator: total times the post was displayed, including repeat views. Best for: paid campaigns and boosted posts where impressions are the controlled variable.
ER by views (video)
ER views = (Engagements ÷ Video Views) × 100
Denominator: total video plays. Best for: Reels, TikTok, and YouTube Shorts where view count is the primary distribution metric.
Average ER across N posts
Avg ER = Sum of (per-post ER) ÷ Number of posts
Brandwatch explicitly recommends computing each post's ER individually and then averaging those rates. Summing all engagements and dividing by summed reach produces a skewed result weighted toward high-reach outliers.
Daily ER
Daily ER = (Engagements in a day ÷ Followers) × 100
Useful for accounts that post multiple times daily and want a single daily performance figure.
Cost per engagement (CPE)
CPE = Total ad spend ÷ Total engagements
Not a percentage. Used by performance marketers to compare paid content efficiency across campaigns.
Understanding views vs. impressions matters here: a view typically means someone watched a video for at least a moment, while an impression counts every time content appeared on a screen. For static posts, impressions and views are often used interchangeably by platforms, but for video they diverge sharply.
How to calculate engagement rate manually, step by step
Manual calculation takes about two minutes per post and gives you a number you can verify against any tool output.
- Pull your post metrics. From Instagram Insights, collect: likes, comments, saves, shares, and reach (or follower count if reach isn't available). Write them down or paste them into a spreadsheet row.
- Choose your denominator. For organic posts, use reach when you have it. Use followers when comparing across accounts or when reach data isn't accessible.
- Sum the engagements. Add likes + comments + saves + shares. If you're including link clicks or profile visits, add those too — but document which you included.
- Divide and multiply. Divide total engagements by your denominator, then multiply by 100.
- Round to one decimal place. Report as a percentage with one decimal: 4.3%, not 4.2857%.
- For multiple posts, average the per-post rates. Calculate each post's ER using steps 1–5, then add those percentages together and divide by the number of posts.
Worked example. An Instagram post gets 420 likes, 38 comments, 55 saves, and 12 shares. Total engagements: 525. The post reached 11,200 accounts.
Using followers instead (the account has 18,500 followers):
The first tells you how the content performed with people who saw it. The second tells you how it performed relative to your total community. Hootsuite's calculator sums the same engagement types and lets you toggle between denominators to see both figures side by side.
How engagement-rate calculators work — inputs, outputs, and what to trust
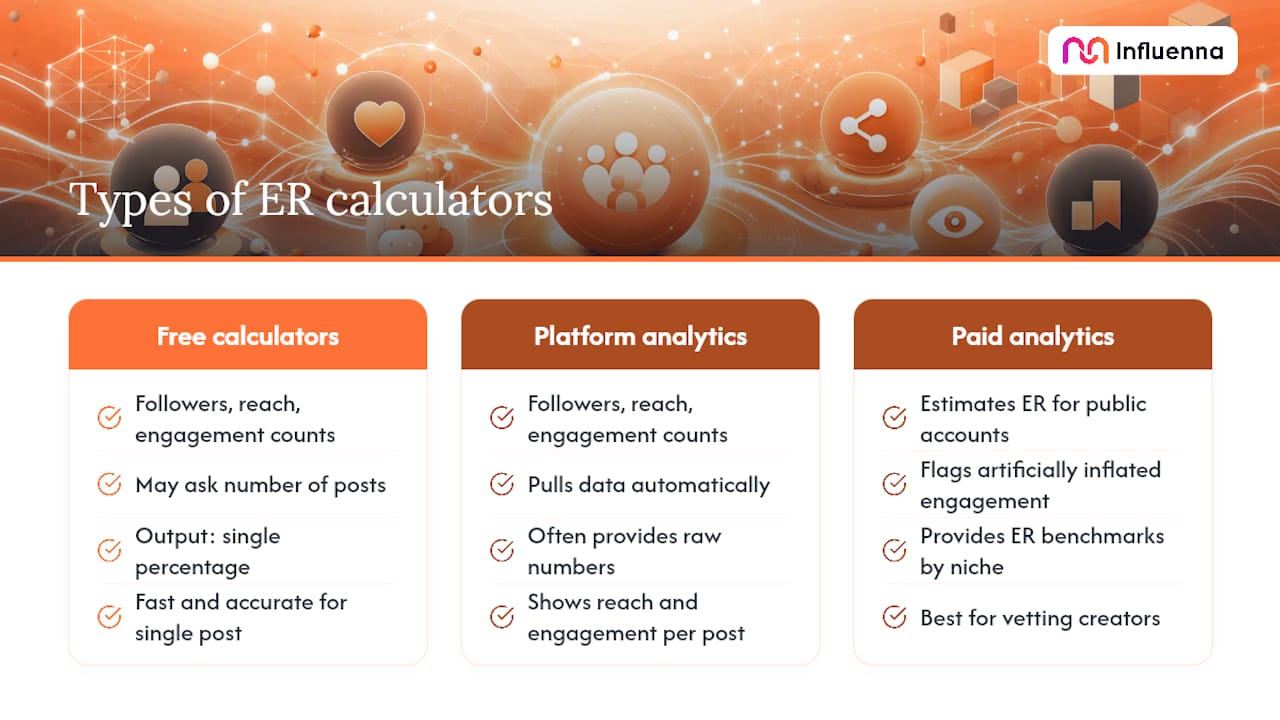
Most free calculators ask for the same core inputs: follower count, reach or impressions, and individual engagement counts (likes, comments, shares, saves, clicks, DMs). Some ask for the number of posts so they can return an average. The output is usually a single percentage, sometimes broken out by denominator type.
Free calculators (Hootsuite's free tool, OmniCalculator) are fast and accurate for single-post calculations. They're best when you need a quick number to include in a pitch or report. The limitation: they don't pull data automatically, so you're copying numbers from Instagram Insights by hand.
Platform analytics (Instagram Insights, TikTok Analytics) give you the raw numbers and sometimes calculate ER directly. Instagram Insights shows reach and engagement counts per post, but doesn't always surface a pre-calculated ER percentage — you still do the division yourself.
Paid analytics platforms like HypeAuditor and TheSocialCat go further. HypeAuditor estimates ER for any public Instagram account and flags accounts where engagement looks artificially inflated relative to follower count. TheSocialCat provides ER benchmarks by niche alongside the raw calculation. These tools are worth the cost when you're vetting a creator for a campaign rather than just checking your own numbers.
One thing to watch: marketing data integrations that pull reach, impressions, and ad spend from multiple sources into one dashboard can make ER calculations across paid and organic content much cleaner. When you're running both organic posts and boosted content simultaneously, a unified data feed prevents the common mistake of mixing organic reach with paid impressions in the same formula.
Instagram benchmarks: what a "good" engagement rate actually looks like
Hootsuite's benchmark guidance puts a typical good engagement rate between 1% and 5%, but that range is too wide to be useful without context. The number that matters is the one for your follower tier and content type.

Instagram engagement rates vary widely by follower tier, typically showing a decreasing trend as follower count grows, with smaller communities often having higher relative interaction.
Instagram Reels typically outperform static posts on ER by views because the algorithm distributes them beyond existing followers.
For a mega-influencer, such a rate would be outstanding. Context is everything.
Platform behavior shifts over time as user habits change. Pew Research's social media use data tracks platform adoption trends that help explain why benchmarks on newer platforms like TikTok tend to run higher than on more mature ones like Facebook.
How to pick the right denominator for your specific goal
The formula you choose should answer the question you're actually asking. MeetEdgar's formula breakdown frames it this way: followers for baseline community engagement, reach for actual viewers, impressions for paid exposure.
| Goal | Recommended metric | Why |
|---|---|---|
| Measure content resonance | ER by reach | Shows how content performed with people who saw it |
| Track community growth | ER by followers | Consistent denominator over time |
| Evaluate paid campaign efficiency | ER by impressions | Impressions are the controlled ad exposure unit |
| Assess video performance | ER by views | Views reflect actual video consumption |
| Compare ad spend efficiency | CPE | Ties engagement directly to cost |
For creators pitching brands: lead with ER by reach. It's the most honest signal of content quality and the one brand managers increasingly ask for. Include ER by followers as a secondary figure to show community baseline.
For performance campaigns: ER by impressions and CPE together tell the full story. One shows content quality relative to exposure; the other ties it to budget.
Common mistakes that make engagement rate misleading
Most ER errors come from inconsistent choices made before the math even starts.
- Using follower count when reach is available. Follower count includes inactive accounts and bots. Reach reflects who actually saw the post. When Instagram Insights gives you reach, use it.
- Summing engagements across posts before dividing. This weights the average toward high-reach posts. Brandwatch's recommendation is clear: calculate per post, then average the rates.
- Mixing denominators mid-report. If you use reach for some posts and followers for others, the resulting average is meaningless. Pick one and apply it consistently across the entire sample.
- Including bot spikes. A post that went viral because of a bot wave will show inflated engagement. Flag these outliers and exclude them when reporting organic performance.
- Inconsistent time windows. Comparing a post measured at 24 hours against one measured at 7 days produces incomparable numbers. Set a standard window (24 hours or 7 days) and apply it to every post in the sample.
- Forgetting to state the denominator. A number without context is just a number. "Our ER is 4.7%" means nothing unless you specify: by reach, by followers, over what time window, and which engagement types were counted.
Pro Tip: When reporting ER to a brand or agency, always include a one-line methodology note: "ER calculated as (likes + comments + saves + shares) ÷ reach × 100, measured at 7 days post-publish, across 12 posts." That single line makes your numbers defensible and shows you know what you're doing.
Copyable templates and worked examples for three common scenarios
These examples use the same post from the manual calculation section (525 engagements, 11,200 reach, 18,500 followers) plus a 12-post sample.
Example 1: Single post, ER by followers
Google Sheets formula: =(B2/C2)*100 where B2 = total engagements, C2 = followers.
Example 2: Same post, ER by reach
Google Sheets formula: =(B2/D2)*100 where D2 = reach.
Example 3: Average ER across 12 posts
Suppose your 12 posts produced per-post ERs of: 4.7, 3.2, 5.1, 2.9, 4.4, 6.0, 3.8, 4.1, 5.5, 2.7, 3.9, 4.3. Sum = 50.6.
Google Sheets formula: =AVERAGE(E2:E13) where column E contains each post's individual ER.
For video content, swap the reach column for view count. For paid ads, swap it for impressions. The arithmetic is identical; only the denominator column changes. OmniCalculator's engagement rate tool follows the same averaging logic if you want to cross-check your spreadsheet output.
What to include when reporting ER to brands or negotiating rates
Brands and agencies want to know the methodology, not just the number.
Reporting checklist:
- Formula used (ER by reach or ER by followers — include both when possible)
- Time window for measurement (e.g., 7 days post-publish)
- Denominator type and value (reach, followers, or impressions)
- Sample size (number of posts included in the average)
- Average ER and your top 3 performing posts with individual ERs
- Platform-specific signals: saves rate, profile visits, story replies
- Whether the sample includes paid/boosted posts (flag these separately)
Pro Tip: Include both ER by reach and ER by followers in every pitch. ER by reach shows content resonance; ER by followers shows community baseline. Together, they give a brand a complete picture — and the gap between the two numbers tells a story about how far your content travels beyond your existing audience.
Brands increasingly ask for standardized reporting because inconsistent metrics make cross-creator comparison impossible. Presenting clean, documented numbers signals professionalism before a single negotiation begins.
The metric that matters more than the number itself
Most creators obsess over whether their ER went up or down week to week. That's the wrong frame. A single percentage point shift on one post tells you almost nothing — it could be the algorithm, the time of day, a trending audio, or a bot wave. What actually matters is the trend across 20 or 30 posts, measured consistently with the same formula and the same denominator.
The other thing worth saying plainly: ER by reach and ER by followers measure different things, and neither is wrong. Reach-based ER tells you how your content performs with people who saw it. Follower-based ER tells you how it performs relative to your community. When you're working with brands, transparency about which formula you used and why is more persuasive than a higher number achieved by picking the most flattering denominator.
Credible metrics are only half the equation for working with brands
Calculating your ER correctly is the foundation. Getting it in front of the right brands is the next step — and that's where most creators lose time to cold outreach that goes nowhere.

Influenna is a curated collaboration marketplace where creators, brands, talent agencies, and influencer marketing agencies connect through structured requests rather than cold DMs. Every account is reviewed by a person before joining, so the brands you reach are real decision-makers, not inboxes that never reply. You set your rates and preferences upfront; contact details are exchanged only after both sides approve the match.
For creators who've done the work of standardizing their ER reporting, Influenna gives those numbers a proper audience. Join the Influenna waitlist to be among the first to connect with vetted brand partners when the marketplace opens.
Sources
- How to calculate engagement rate: 2026 formulas & benchmarks
- How to Calculate Engagement Rate | Mailchimp
- Engagement rate calculator
- Engagement Rate Formula: How to Calculate It for Every Social Platform | MeetEdgar
FAQ
What is the formula for engagement rate?
The most common formula is ER by reach: (Total Engagements ÷ Reach) × 100. Alternatives use followers, impressions, or views as the denominator depending on your goal.
How do I calculate my engagement rate manually?
Sum your likes, comments, saves, and shares for a post, divide by your reach (or follower count), and multiply by 100. For multiple posts, calculate each post's ER individually and average those percentages.
Is a 5% engagement rate good on Instagram?
For very large accounts, it would be exceptional. Benchmarks shift significantly by follower tier.
Is a 4.2% engagement rate good on Instagram?
Yes.
Why does my ER by reach differ from my ER by followers?
The two formulas answer different questions. ER by reach measures how content performed with people who saw it; ER by followers measures performance relative to your total community, including inactive accounts. The gap between the two often reflects how much of your audience is actively seeing your posts.