Influencer Campaign Reporting: Templates and ROI Examples
22 min read

A repeatable influencer campaign report begins with one paragraph that tells the whole story before anyone opens a spreadsheet. Here is a paste-ready BLUF template you can drop into any stakeholder deck:
Campaign: [Campaign Name] | Dates: [Start Date – End Date] | Objective: [Primary Goal, e.g., drive 500 tracked conversions at a CPA under $40]. The campaign [met / missed / exceeded] its primary KPI: [Result vs. Target, e.g., 612 tracked conversions at a $34 CPA]. The two strongest drivers were [Driver 1, e.g., Creator A's TikTok series] and [Driver 2, e.g., Instagram Stories with promo code SAVE20].
Quick facts:
- Reach: [X unique accounts]
- Impressions: [X total]
- Engagement rate: [X]
- Tracked conversions: [X]
- Total spend: [$X]
- Earned Media Value (EMV): [$X estimated]
Pro Tip: *Write the BLUF for your CFO, not your analytics team. If a sentence requires knowing what "ER" or "CPM" means to parse, replace it with plain language.
Good influencer campaign reporting, as a discipline, sits at the intersection of media measurement and direct-response attribution. According to Influencer Marketing Hub, 70% of marketers now measure the ROI of their influencer activity, and the metrics they track fall into three broad categories: immediate campaign metrics, ROI and sales metrics, and brand awareness and sentiment metrics. The sections below walk through each layer, from raw data collection through to budget-linked recommendations.
Key Takeaways
Structured influencer campaign reporting requires a BLUF-first format, per-creator attribution, and a clear data provenance trail from discovery through to conversion.
| Point | Details |
|---|---|
| Lead with the BLUF | Open every report with one paragraph: campaign, goal, result vs. target, and one immediate recommendation. |
| Normalize KPIs per creator | Use conversions per 1,000 followers and ROAS per creator to compare performance fairly across different audience sizes. |
| Validate before you report | Cross-check promo code redemptions against GA4 conversions; a gap over 10% signals a tracking break, not underperformance. |
| Present ROI as a range | Lower bound is tracked conversions only; upper bound adds a conservative modeled lift to avoid overclaiming. |
| Influenna improves provenance | Structured collaboration requests capture deliverable details and platform specifics before launch, reducing reconciliation work post-campaign. |
Table of Contents
- What metrics should you track in an influencer campaign report?
- How do you collect and unify campaign data reliably?
- Which tools should you use to build your reporting stack?
- How do you calculate ROI, ROAS, and Earned Media Value?
- How should you structure a full influencer campaign report?
- What are the most common reporting mistakes, and how do you avoid them?
- How do you turn report data into budget-linked recommendations?
- Why provenance is the real problem in influencer reporting
- Influenna helps you start campaigns with cleaner data
- Sources
What metrics should you track in an influencer campaign report?
Organizing KPIs by funnel stage keeps your report readable and prevents the common mistake of treating impressions as proof of business impact.
Awareness metrics
- Impressions: total times content was displayed, including repeat views by the same account.
- Reach: unique accounts that saw the content. Reach is the more conservative and usually more honest number.
- View-through rate (VTR): for video, the percentage of viewers who watched to a defined threshold (typically 3 seconds, 15 seconds, or 100%). Platform definitions differ, so note which threshold you used.
Engagement metrics
- Engagement rate (ER): the most debated formula in the industry. Two common versions: ER by reach = (likes + comments + saves + shares) / reach; ER by impressions = same numerator / impressions. ER by reach is higher and more flattering; ER by impressions is more conservative. Pick one and apply it consistently across every creator in the report.
- Saves: on Instagram especially, saves signal genuine intent and are harder to game than likes.
- Comments: qualitative signal. A post with 200 substantive comments often outperforms one with 2,000 emoji reactions for brand recall.
- Watch time / average view duration: the primary quality signal on YouTube and TikTok.
Traffic and intent metrics
- Link clicks and CTR: clicks from swipe-ups, bio links, or tracked URLs divided by impressions or reach.
- Landing page behavior: bounce rate, time on page, and pages per session from the UTM-tagged URL in Google Analytics 4 (GA4). A creator who drives 5,000 clicks with a 90% bounce rate is not the same as one who drives 2,000 clicks with a 40% bounce rate.
Conversion and financial metrics
- Tracked conversions: purchases, sign-ups, or other goal completions attributed via UTM parameters, promo codes, or affiliate links.
- Promo code redemptions: direct, creator-level attribution. Match redemption counts against your CRM to catch duplicates.
- Revenue: total revenue attributable to the campaign, by creator where possible.
- ROAS: revenue divided by spend. A ROAS of 3.0 means $3 returned for every $1 spent.
- Cost per acquisition (CPA): total spend divided by tracked conversions.
- EMV: a proxy for the advertising value of earned content. Covered in detail in the ROI section below.
Operational metrics
Track these in the same report, not a separate spreadsheet:
- Deliverables agreed vs. delivered
- On-time delivery rate
- FTC disclosure compliance (was #ad or #sponsored present on every paid post?)
- Creative variants delivered (A/B versions, story vs. feed, etc.)
- Missed or late posts and the reason
Pairing sentiment analysis with these standard metrics gives you a fuller picture of brand impact, especially for awareness-stage campaigns where conversions are not the primary goal. Track sentiment before and after the campaign window to see whether the conversation shifted.
Pro Tip: For cross-creator comparisons, normalize KPIs to follower count. "Conversions per 1,000 followers" surfaces a micro-creator who outperforms a macro on efficiency, even if the macro's raw numbers look bigger.
How do you collect and unify campaign data reliably?
Garbage in, garbage out. The most common reason influencer reports lose credibility with finance teams is not bad math — it is inconsistent data collection. Run this checklist before the first post goes live.
Pre-flight checklist
- UTM parameters agreed and documented (see structure below)
- Promo codes assigned per creator, not per campaign
- Affiliate IDs set up and tested
- GA4 property confirmed and goals/conversions configured
- Content naming convention shared with all creators (e.g.,
[BrandName]_[CreatorHandle]_[Platform]_[PostType]_[YYYYMMDD]) - Deliverable deadlines locked in writing
- Screenshot or export format agreed for creator-provided metrics
UTM structure
A clean UTM string for influencer work looks like this:
utm_source=instagram&utm_medium=influencer&utm_campaign=summer26&utm_content=creatorA_reel_20260615
The utm_content field is where most teams leave money on the table. Encoding the creator handle, content type, and post date here means GA4 can break down traffic and conversions at the post level, not just the campaign level.
Three data collection modes
Mode 1: Platform APIs and native exports. Instagram, TikTok, and YouTube all offer native analytics exports. Third-party influencer analytics platforms (Modash, GRIN, Upfluence, Brandwatch) pull these via API and aggregate them. API data is more reliable than screenshots because it is timestamped and auditable.
Mode 2: UTM tracking in GA4. This is your conversion source of truth. GA4 captures sessions, events, and conversions from every UTM-tagged link. Cross-reference GA4 conversion counts with promo code redemptions to catch attribution gaps.
Mode 3: Influencer-provided reporting. Screenshots and exported CSVs from creators. Treat these as supplementary, not primary. Screenshots can be edited; exports can be cherry-picked. Flag any metric that comes only from creator-provided data in your methodology section.
Validation steps
Before you build the report, run these checks:
- Duplicate post detection: the same post URL appearing twice in your dataset inflates every metric.
- Impression authenticity: a sudden spike in impressions with near-zero engagement is a red flag.
- Timestamp cross-check: confirm post dates in the API export match the creator's reported dates.
- Promo code reconciliation: match redemption counts in your e-commerce platform against GA4 goal completions. A large gap usually means tracking is broken, not that the creator underperformed.
UTM parameters, promo codes, and GA4 are the standard attribution stack for tying influencer activity to web conversions. The table below shows the minimum fields for a unified dataset, one row per post.
| Field | Description | Source |
|---|---|---|
| date | Post publish date | Platform API / creator export |
| platform | Instagram / TikTok / YouTube | Platform API |
| influencer_id | Creator handle or unique ID | Contract / platform |
| post_id / URL | Unique post identifier | Platform API |
| impressions | Total displays | Platform API |
| engagements | Likes + comments + saves + shares | Platform API |
| clicks | Link clicks from tracked URL | GA4 / affiliate platform |
| conversions | Goal completions | GA4 / promo code system |
| revenue | Attributed revenue | CRM / e-commerce platform |
| promo_code | Creator-specific code used | E-commerce platform |
| deliverable_status | Delivered / late / missing | Campaign tracker |
Pro Tip: Add a metric_source column to every row. When a stakeholder asks "where did this number come from?", you can answer in one lookup instead of digging through three platforms.
Which tools should you use to build your reporting stack?
Most practical measurement stacks combine three layers: a web analytics platform for conversion data, a dashboarding tool for visualization, and an influencer analytics platform or marketplace for creator-level content metrics.
Layer 1: Web analytics
Google Analytics 4 is the baseline. Configure conversion events before the campaign starts, not after. GA4's Explorations feature lets you build custom reports filtered by UTM source and content, which is where your per-creator traffic breakdown lives. Without GA4 configured correctly, you are relying entirely on platform-reported metrics, which do not capture what happens after the click.
Layer 2: Dashboarding and visualization
Looker Studio (formerly Google Data Studio) connects directly to GA4, Google Sheets, and several third-party connectors. It is widely used to create custom charts and visualize cross-channel KPIs in a single view. The practical advantage: you build the dashboard once and refresh it for every campaign by updating the data source. For stakeholders who do not live in spreadsheets, a Looker Studio link is far more useful than a 40-tab Excel file.
Layer 3: Influencer content and audience metrics
Native platform analytics cover your own posts. For creator-level metrics, you need either direct API access (which most platforms restrict) or a third-party aggregator. Here is how the major options differ in practice:
- Modash: strong on creator discovery and audience analytics; pulls Instagram, TikTok, and YouTube metrics; useful for post-campaign content aggregation and fraud detection.
- GRIN: built for e-commerce brands; integrates with Shopify and WooCommerce for direct revenue attribution; handles affiliate and promo code tracking natively.
- Upfluence: combines discovery, outreach, and reporting; its reporting module exports per-creator performance data in CSV for import into Looker Studio or a data warehouse.
- Brandwatch: primarily a social listening and sentiment platform; pairs well with standard metrics when brand perception measurement is a campaign goal.
Integration patterns
Three approaches, in order of sophistication:
- Connector-based dashboard: Looker Studio connectors pull from GA4 and a Google Sheet (populated manually or via Zapier). Low setup cost, works for most campaign teams.
- Scheduled exports: weekly CSV exports from each platform, consolidated in a master Google Sheet. Manual but auditable.
- API to data warehouse: GA4 data API, platform exports, and affiliate data flow into BigQuery or a similar warehouse; Looker Studio queries the warehouse. Best for teams running multiple concurrent campaigns.
Pro Tip: Set up conversion tracking and UTM validation first, before you invest time in any dashboarding tool. A beautiful Looker Studio dashboard built on unvalidated data is just a faster way to present wrong numbers.
How do you calculate ROI, ROAS, and Earned Media Value?
Three formulas matter most in influencer campaign reporting. Here they are, with a worked example.
ROI = (Revenue – Cost) / Cost × 100
ROAS = Revenue / Spend
EMV is not a standard formula. The most common approach multiplies impressions (or engagements) by a rate card value, typically the CPM or CPE equivalent for paid media in the same channel. A common simplified version: EMV = Impressions × (Paid CPM / 1,000). The rate card is subjective, which is why EMV works best as a supplementary metric, not a primary one.
Worked example
- Total spend: $15,000 (three creators, flat fees)
- Tracked conversions via promo codes: 480 purchases
- Average order value: $65
- Attributable revenue: $31,200
- ROAS: $31,200 / $15,000 = 2.08
- ROI: ($31,200 – $15,000) / $15,000 × 100 = 104.7%
- EMV estimate: 4.2M impressions × ($8 CPM / 1,000) = $33,600
The EMV of $33,600 is higher than the tracked revenue. That is normal and expected. EMV captures the media value of content that did not directly convert, including organic shares and saves. The risk is using EMV to justify a campaign that did not hit its conversion targets. State EMV alongside tracked revenue, not instead of it.
When to include Customer Lifetime Value (CLV)
For subscription products or brands with high repeat-purchase rates, a single tracked conversion understates the true value of an influencer-acquired customer. Industry guidance recommends planning for CLV analysis to capture long-term influencer value. A simple approach: pull the cohort of customers acquired during the campaign window from your CRM, track their 90-day and 180-day revenue, and compare their LTV to your baseline customer LTV.
| Input | Formula role | Where to source it |
|---|---|---|
| Total spend | Cost in ROI / denominator in ROAS | Campaign budget tracker |
| Tracked revenue | Revenue in ROI / numerator in ROAS | GA4 + promo code system |
| Impressions | EMV numerator | Platform API / influencer analytics tool |
| Rate card CPM | EMV multiplier | Paid media benchmarks for the channel |
| Conversions | CPA denominator | GA4 / affiliate platform |
| CLV estimate | Long-term ROI adjustment | CRM cohort analysis |
Pro Tip: Present ROI as a range, not a single number. Lower bound = tracked conversions only. This is more defensible than a single figure and signals analytical honesty to finance teams.
How should you structure a full influencer campaign report?
Starting with the narrative — wins, losses, next steps — then backing it up with data reduces stakeholder confusion and keeps executives engaged past slide two. Here is a section-by-section structure you can copy into a slide deck or PDF.
Recommended report sections
- Executive BLUF (slide 1): one paragraph, paste the template from the opening of this article. State the campaign, goal, result, and one recommendation.
- Campaign overview (slide 2): dates, creators, platforms, total spend, and deliverables agreed vs. delivered.
- Headline KPIs vs. targets (slide 3): a simple table or scorecard. Green/amber/red against each target. No narrative yet.
- Trend visuals (slide 4): time-series chart of daily impressions and conversions across the campaign window. Shows pacing and any spikes worth explaining.
- Per-creator breakdown (slide 5): one row per creator. Columns: creator handle, follower count, impressions, ER, clicks, conversions, revenue, cost, ROI, deliverable status.
- Creative performance (slide 6): top three and bottom three posts by conversion rate. Include thumbnails. This is the slide that informs the next brief.
- Spend and conversion breakdown (slide 7): stacked bar by creator or platform showing spend allocation vs. conversion share. A creator who received 40% of budget but drove 60% of conversions is a reallocation signal.
- Methodology and provenance (slide 8): one paragraph explaining which metrics came from which source. This is not optional. Finance and legal teams will ask.
- Risks and validation checks (slide 9): flag any data quality issues, missing posts, or authenticity concerns.
- Recommendations and next steps (slide 10): three to five prioritized actions with a named owner and a timeline.
- Appendix: raw data export, UTM mapping, promo code reconciliation, and full attribution logic.
A post-campaign analysis template that separates the executive summary from the detailed execution review lets different audiences get what they need without wading through data that is not relevant to them. The BLUF and KPI scorecard serve the CMO; the methodology and appendix serve the analyst.
Campaign performance reviews are most useful when they combine a one-paragraph executive summary, objective-by-objective performance, and clear recommendations for next actions. That structure maps directly to slides 1, 3, and 10 above.
Per-creator table schema
| Column | Definition |
|---|---|
| influencer_id | Creator handle or unique ID |
| follower_count | At time of campaign |
| impressions | Total from API |
| engagement_rate | Engagements / reach (state formula used) |
| clicks | From tracked URL |
| conversions | Promo code + GA4 |
| revenue | Attributed revenue |
| cost | Flat fee + any bonuses |
| ROI | (Revenue – Cost) / Cost |
| deliverable_status | Delivered on time / late / missing |
Chart selection guide
- Time-series line chart: daily impressions and conversions. Shows pacing and identifies which posts drove spikes.
- Stacked bar chart: spend vs. conversion share by creator or platform. Surfaces budget efficiency at a glance.
- Scatter plot: engagement rate (x-axis) vs. conversions (y-axis) per creator. The creators in the top-right quadrant are your next brief.
Pre-send QA checklist
- Confirm every metric traces back to a named source (API, GA4, promo code system, or creator export).
- Verify UTM consistency: all tracked links in the campaign use the agreed naming convention.
- Cross-check promo code redemption counts against GA4 conversion events. A gap over 10% needs an explanation.
- Confirm FTC disclosure compliance: every paid post carries #ad or #sponsored.
- Check that the BLUF numbers match the detailed slides exactly. A discrepancy between slide 1 and slide 7 destroys credibility.
What are the most common reporting mistakes, and how do you avoid them?
The mistakes that damage reporting credibility fall into three categories: measurement gaps, attribution errors, and data quality failures.
Measurement gaps
Using impressions as the sole proof of impact. Impressions measure delivery, not effect. A campaign that delivered 10 million impressions but zero tracked conversions is not a success story. Pair impressions with at least one downstream metric: clicks, conversions, or a pre/post sentiment shift.
Ignoring attribution windows. A customer who saw an influencer post on Monday and converted on Friday may not appear in a 1-day attribution window. Set your GA4 attribution window before the campaign starts and document it in the methodology section. Last-click attribution systematically undercounts influencer impact because the final touch is often a branded search or a direct visit.
Not tracking creative variants. If Creator A posted three versions of the same product shot, you need to know which one drove conversions. Without post-level UTMs, you cannot tell.
Attribution errors
**Multi-touch attribution vs. For influencer campaigns, this undercounts awareness-stage creators who primed the audience but did not close the sale. A data-driven or linear attribution model in GA4 distributes credit more fairly, though it requires more setup.
Blending platform metrics across channels. Instagram reach, TikTok views, and YouTube impressions are measured differently. Never add them into a single "total reach" figure without noting the methodology. Report them separately and label the source for each.
Data quality failures
Accepting creator screenshots without cross-checking. Screenshots are editable. If a creator's reported impressions are significantly higher than what your UTM data implies, flag it. Request a native export or API pull instead.
Failing to preserve provenance. If you cannot tell a stakeholder six months later where a specific number came from, the report is not auditable. The metric_source column in your unified dataset (described in the data collection section) solves this.
Red flags to watch for
- Engagement rate above 15% on a large account (over 100K followers) with no verified explanation
- Promo code redemptions that exceed GA4 conversion events by more than 15%
- Impressions that spike sharply on a post with no shares, saves, or comments
- A creator who delivers screenshots but declines to share a native export
- Follower count that grew by more than 10% in the week before the campaign
Pro Tip: Gate performance bonuses on verified, tracked outcomes — promo code redemptions confirmed in your CRM, not self-reported metrics. This one change improves data quality faster than any analytics tool.
How do you turn report data into budget-linked recommendations?
Effective influencer reporting is a decision-making tool that links creator activity to business outcomes and supports budget or strategy changes. A report that ends with "performance was strong" is not a decision tool. One that ends with "reallocate $8,000 from Creator C to Creator A for a 30-day extension, projected to add 200 incremental conversions at the same CPA" is.
Prioritization rubric
Score each creator, channel, and creative format on two dimensions: impact (revenue or conversion contribution, normalized by spend) and confidence (how clean is the attribution?). A creator with high impact and high confidence gets scaled. High impact but low confidence gets a structured test with better tracking. Low impact and high confidence gets paused.
Sample recommendation phrases
- Scale: "Creator A delivered a ROAS of 3.4 with clean UTM attribution. Recommend a 60-day extension at the current rate, with two additional content formats (Reels + Stories) to test incremental reach."
- Reallocate: "Creator C's CPA of $89 is 2.6× the campaign average. Reallocating Creator C's remaining $4,000 to Creator B at Creator B's current CPA would project 47 additional conversions."
- Test: "The TikTok series drove 38% of conversions on 22% of spend. Recommend a $5,000 incremental test with two new TikTok creators to validate channel efficiency before the Q4 campaign."
- Pause: "Creator D missed two of four deliverables and drove zero tracked conversions. Do not renew without a revised deliverable agreement and promo code tracking in place."
Presenting uncertainty to leadership
When confidence is medium, say so and ask for a small test budget rather than a full reallocation. Frame it as: "Our tracked data suggests X. Our modeled estimate suggests Y. A $3,000 test over four weeks would give us enough data to commit to a larger investment." Finance teams respect ranges and payback periods more than single-point estimates.
Pro Tip: When packaging a budget ask for finance, lead with incremental revenue range, payback period, and who owns the result. "A $10,000 extension is projected to return $18,000–$24,000 in tracked revenue within 45 days; [Name] owns the measurement" is a fundable request. "We think it will perform well" is not.
Why provenance is the real problem in influencer reporting
Most reporting problems are not analytics problems. They are provenance problems. You have the data, but you cannot prove where it came from, who agreed to what deliverable, or whether the creator's numbers are the same ones you pulled from the API. That gap between "we ran a campaign" and "we can defend every number in this report" is where most post-campaign reviews fall apart.
The structural cause is how campaigns start. When discovery happens through cold DMs and deliverables are negotiated over email threads, there is no single record of what was agreed. UTMs get set up late, promo codes get shared in a Slack message nobody saved, and the creator's final post uses a different handle than the one in your tracking sheet. By the time you are building the report, you are reconciling three different versions of the truth.
Structured workflows fix this at the source. When collaboration requests carry agreed deliverable details, rates, and platform specifics from the start, the metadata that makes attribution reliable exists before the campaign launches, not after. That is not a reporting tool problem. It is a workflow problem, and it compounds with every campaign you run without solving it.
The industry is moving toward standardized data schemas and API-first measurement, but the tooling only works if the upstream data is clean. The teams that will report with confidence in the next few years are the ones building structured workflows now, not the ones adding another analytics layer on top of a messy discovery process.

Influenna helps you start campaigns with cleaner data
One of the quietest costs in influencer reporting is the time spent reconciling what was actually agreed. When collaboration details live in DMs and email threads, UTMs get set up late, deliverable names drift, and promo codes get shared informally. By the time you are building the report, you are stitching together three versions of the same campaign.
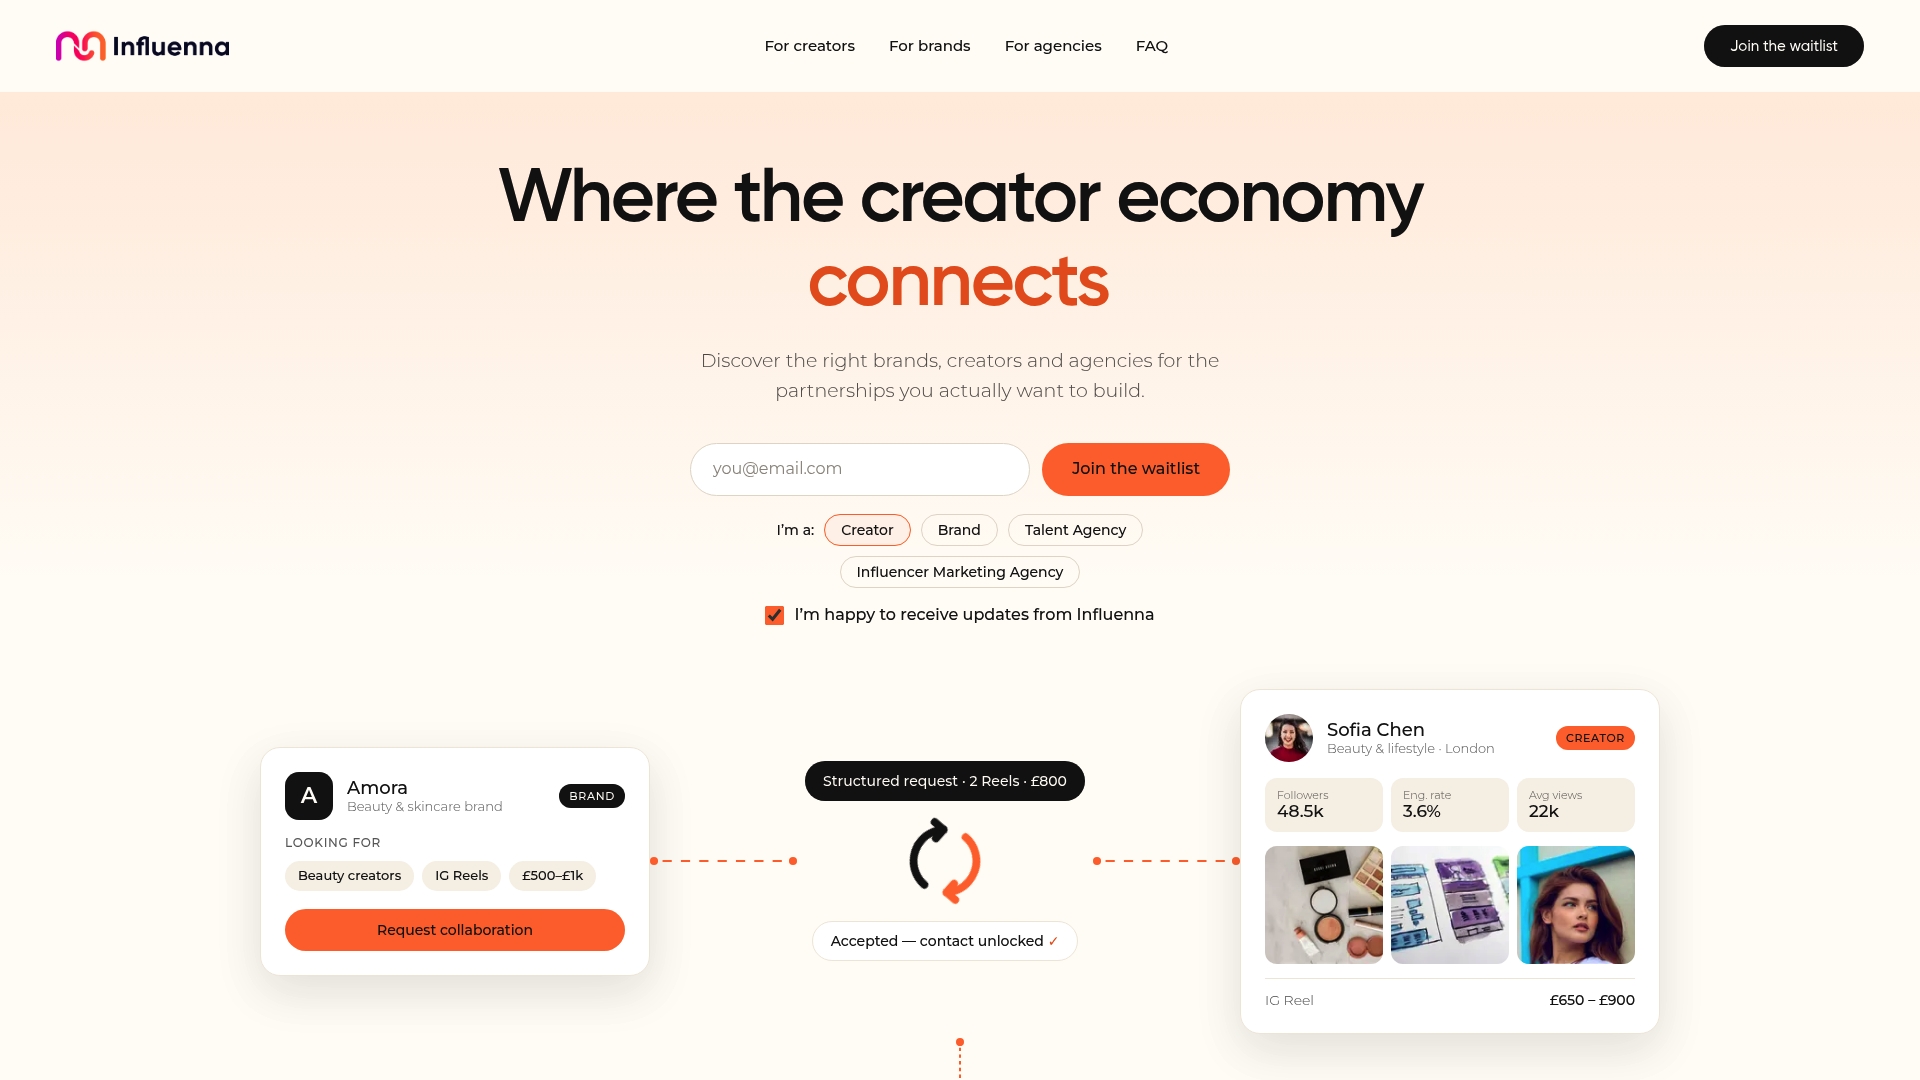
Influenna is a curated marketplace where brands, creators, talent agencies, and influencer marketing agencies connect through structured collaboration requests, not cold outreach. Every account is reviewed before joining. Deliverable details, rates, and platform preferences are part of the request from the start, which means the metadata your reporting stack depends on exists before the first post goes live. Contact details are exchanged only after both sides approve, so the workflow stays clean from discovery through to measurement.
The product is pre-launch. If you want cleaner attribution from the first campaign, Influenna and be among the first to access the marketplace when it opens.

Sources
The following primary sources and templates back the methods in this guide:
- How to Measure Influencer Campaigns Effectively in 2026
- Influencer Reporting: How To Measure Impact & Prove ROI
- Campaign Performance Review & AI Prompt | Comms With AI
- Post-campaign analysis report template
- Free Campaign Performance Report Template | Ready in Seconds